How can enterprises achieve data visualization management?
When it comes to enterprise management, it is a big question that involves many aspects such as strategy, operation, and marketing. The ultimate goal of improving management is to enhance core competitiveness in terms of cost, quality, delivery time, efficiency, and so on. With intelligencemanufactureWith the advent of the times, data visualization has become increasingly popular due to the popularity of intelligent manufacturing. The application of factory level data visualization has been further popularized, and the demand for improving factory production management through data visualization is becoming increasingly strong.
So, in the PCB field:
Is data visualization important for enterprises?
My answer is important.
Data visualization is the presentation of data in a visual manner. It is not a new technology, but it is an important application for factories to achieve intelligent management.
So, why is data visualization important for businesses? Let me make a few points first:
1. Collecting more data for more accurate analysis
With the expansion of enterprise scale and the increase of production data, the previous method of collecting production data and equipment data through Excel is no longer suitable for the development needs of enterprises. It is urgent to use information technology to solve the collection, analysis, and management of enterprise production data.
2. Beneficial for improving the efficiency of enterprise work
In order to better serve the filling personnel, improve work efficiency, and reduce the pressure of data aggregation at all levels, a scientific production data collection system is established based on the industrial IoT data platform, replacing the previous use of Excel collection and aggregation methods, and reducing the pressure of data reporting and collection aggregation for personnel at all levels. utilizebig dataEstablish different datasets on the platform to scientifically manage and analyze various types of data. The extracted data report enables dynamic monitoring of the entire production process.
Targeting different personnel such as company leaders, executives, workshop directors, and general workers, key indicators of enterprise operation status are indicated through various intuitive data (K)PI)。
3. Help with precise decision-making
Data is the fertile soil that provides decision support, and clear and concise data reports help production management personnel quickly understand factory production dynamics and respond quickly. On the other hand, based onAIIndustrial brain, capable of automatic planning and scheduling, quality modeling, and cost savingsmaterialThe purpose is to assist enterprises in making quick and accurate decisions.
How to achieve data visualization management?
Factory level data visualization is an inevitable product of the industrial Internet of Things and big data technology, and the visualization data screen reflects the application results of new technologies. Transforming scattered and disordered data sources into understandable visual reports is a process of data understanding, which is achieved through big data analysis - looking at colors, distinguishing length, distinguishing height, and flipping tables. This greatly shortens the time required to understand data, reduces labor costs, and improves efficiency.
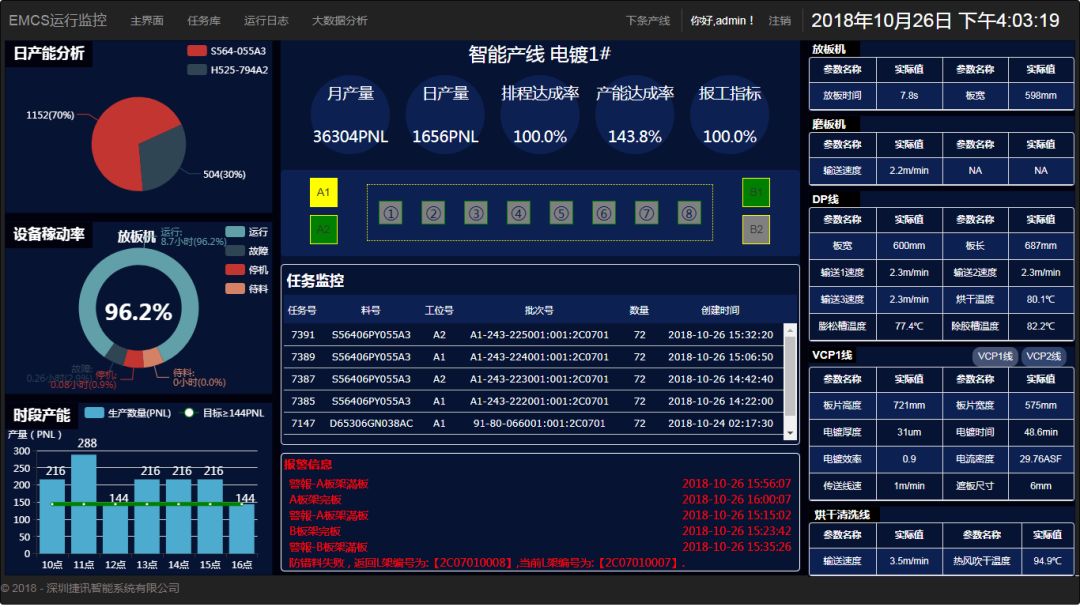
Big Data Dashboard
As a focused companyPCBAs a national high-tech enterprise in the planning and construction of smart factories, Jiexun has pioneered the creation of the industry's first "Industrial Internet of Things and Big Data Platform". Through the Internet of Things gateway, different production equipment, testing equipment, logistics equipment, warehousing equipment, etc. are connected to obtain real-time data on people, machines, materials, methods, environment, etc. After analysis and processing, data management reports are formed. Real time access to data reports uploaded to the terminal through EMI and APP, achieving data visualization management.
The data reports extracted based on the Internet of Things and big data platforms accurately reflect high-value information such as equipment operation status and production line conditions, further enhancing the factory's intelligent manufacturing capabilities and improving business efficiency and productivity.
数据可视化的提前是工业物联与大数据分析,设备间的互联互通至关重要;捷讯已联合数百家设备厂商推进标准化通信协议,有效避免智能工厂建设在通信集成环节重复开发,节省80%的投入。从通讯,数据交互,业务逻辑,程序模块,报文协议等角度从浅入深,引导设备商接入物联网信息交换平台。
智能化改造过程中,新技术的应用并不是目的,改造升级的根本目的是提升产品和服务的竞争力,让企业获得更大的竞争优势。
让我们借助技术的支点,撬动管理的提升。
文章来源:【微信号:pcbworld,微信公众号:PCBworld】
Editor He Yang of this website/Organizing